

Metrics
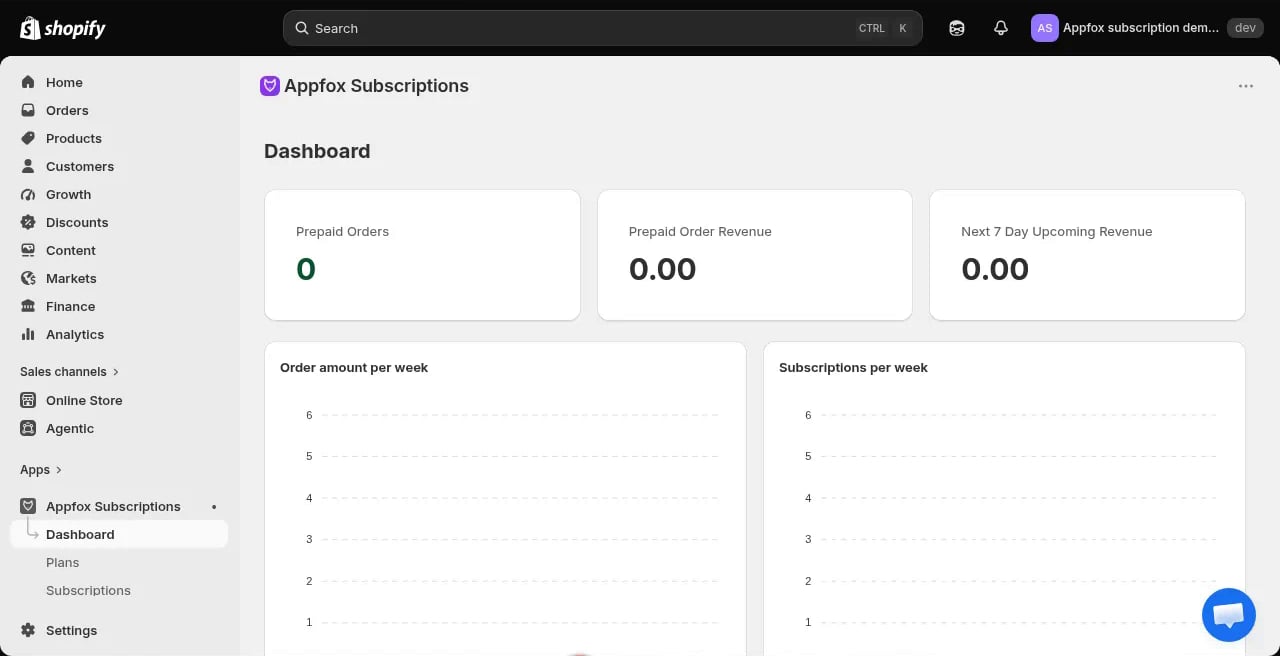
The dashboard displays the following metrics:Prepaid orders
The number of upcoming orders that customers have already paid for through their subscription.Prepaid order revenue
The total revenue from prepaid orders. This represents future revenue that has already been collected.Next 7 day upcoming revenue
The expected revenue from subscriptions scheduled to bill in the next seven days.Order amount per week
A chart showing the total order value for each week. This helps you track weekly subscription revenue trends.Subscriptions per week
A chart showing how many new subscriptions were created each week. Use this to monitor subscription growth.Total active customers
The number of customers with at least one active subscription.Average order value
The mean order value across all subscription orders.Total failed payments
The count of billing attempts that failed. High numbers here indicate dunning or payment issues.Total active subscriptions
The current count of active subscription contracts.Total paused subscriptions
The number of subscriptions that customers have paused.Total cancelled subscriptions
The total number of subscriptions that have been cancelled.How metrics update
Metrics update in real time as subscription activity happens. When you first install the app, the dashboard will be empty. As customers place orders and billing cycles run, you’ll see data populate the charts and metrics.If you just installed the app, give it time to collect data. The dashboard fills in as customers subscribe and billing events occur.
Use the dashboard
Review the dashboard regularly to:- Monitor subscription growth week over week
- Identify revenue trends
- Track active subscriber count
- Spot payment issues by checking failed payments